Saturday, March 17, 2007

Stocks in Dangerous Ground

As the weekly chart below shows, the current correction is stalled, waiting for new positions from investors.


First, notice the big volume day of February. Since then, prices have made new lows each week, but have closed strongly. This is a neutral sign.

Second, notice prices have retreated both of the last two weeks after reaching the same price level. This means sellers are waiting at that level.

Finally, the downward revisions to GDP are telling investors to beware, a slowdown might be coming. The Fed program to slow bank lending might be working.

In the face of a potential slowdown in the US economy, the Fed would like to cut short term rates.

GOLD

Gold prices are signaling potential inflation.


This is the market the Fed watches. Recall the peak in gold prices coincided with the end of the rise in Fed Funds. At the same time, the current rally in bond prices began.

Notice prices have not made new lows since the low of $560 in 2006.

With potential inflation looming, the Fed cannot cut short term rates.

MONEY
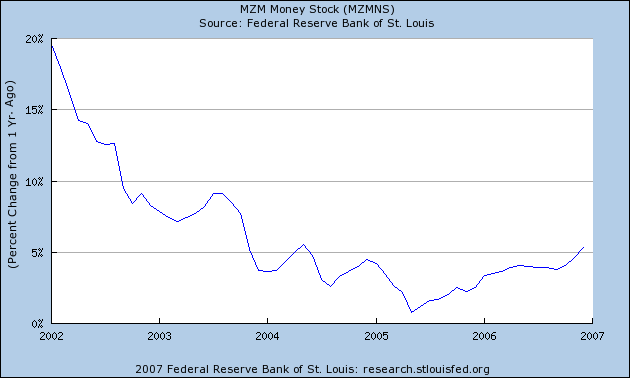
The Fed has been raising short term rates since the middle of 2002 and money growth slowed dramatically at first, from 20% to a low growth rate near zero in 2005.

Here's the problem: since the trough in growth rates in 2005, money began to grow again, and continues to grow at faster rates - 6% in the latest data.


This has to be troublesome for the Fed.

With money growth this strong, the Fed cannot cut short term rates.

TACTICS
Stay out of the stock and bond markets.

Stick with money market arbitrage. It's safe and profitable.

Lengthen liability maturities as rates allow.

Continue to shorten asset maturities. Place all new cash in Fed Funds and other short term instruments.

STRATEGY
Tell the board things are under control.

The spread continues to widen, making the bank more profitable.

The portfolio is nearly balanced, assets are over-weighted in the short end of the curve, and no hedging is required.

Tuesday, March 13, 2007

Stock Market Headed Lower?

The rest of this week will tell investors what's happening, and it doesn't look good.

As the chart below shows, the danger now is a significant move down.


Prices have risen 4 out of the last five days, and could not get above the big volume day of February 27th.

Prices are now headed lower and technical traders will sell this market as prices drop below the lows of the 27th.

Tuesday, March 06, 2007

Storm Strengthens

VOLUME yesterday was not enough to say this decline is over.

BEWARE the continuing fall in stock prices.

DO NOT add new money to the stock market.

STAND BY for continuing updates.

Monday, March 05, 2007

STOCK MARKET WARNING - HURRICANE

Stocks made new lows, and closed at the low.

If volume was light, this could mean a prolonged correction.

The Fed has a habit of doing this.

KEEP YOUR POWDER DRY.
Fed funds will yield a riskless 5.25%. Take it

With today's price action, the technical traders will be licking their lips and fighting for a place in the pit to see this market and sell it if it goes south.

If we continue down for many more days, we will be below the large volume days of the last week in February, and that will become resistance.

The Techs will attack the NYA every time it pokes into resistance.

That will make it harder to bounce back.

Summary
We are still in a bull market, don't worry, but this could get ugly.

New Lows in Stocks

The stock market is making new lows.

Get out of the way.

Friday, March 02, 2007

Gold Falls to $646

Late Friday, March 2nd, gold broke support, closing at $646.

This is good news for everyone.

Be Careful Here

VOLATILITY!

In the past two weeks we've seen volatility in gold, bonds, and stocks.

Something is going on be very careful.

This post was written before market close on Friday.

GOLD


NOTICE - Volatility started Wednesday the 21st of February and has continued, with prices falling a week later on the 28th, and then breaking support and making new lows on Friday the 2nd of March.

BONDS


NOTICE - Bonds began their recent climb at the end of January, and spiked on Tuesay the 27th of February.

STOCKS


NOTICE - Stocks broke on Tuesday the 27th while bonds were spiking.

Wednesday, January 24, 2007

Bonds back at support

Since the last report, bond prices have steadily risen to 115 and then declined to 110, bringing prices back to the same levels of last October.

Time to buy again? Prices are at support. Time to sell if support breaks?

The answer to the first question is no more buying long term assets.

The answer to the second question is yes, sell if bonds break major support.

Money Market Arbitrage is the tactic of choice.

First, we look at the gold market.


GOLD FUTURES PRICES

Notice gold spiked back in June of 2006 and has stabilized at the $620 level and shows no sign of breaking out of this range.

Next, examine the money supply,


MONEY SUPPLY - MZM

Here we have troubling information. The money supply is still growing at an accelerating rate.

These numbers signal to both bonds and gold inflation is still a risk.

For this reason alone, it is prudent to keep an eye on the details of money growth.

What has the Fed been doing with the Monetary Base?


ST. LOUIS ADJUSTED MONETARY BASE

Base growth is declining, showing Fed restraint.

What have commercial banks been doing?


COMMERCIAL AND INDUSTRIAL LOANS

Here's the answer. Demand for credit is still running at 10% per year - even with Fed Funds at 5.25%!

This is a strong economy, with strond demands for credit, leading to strong growth in money.

If money growth is not met by equally strong growth in economic activity, inflation results.

How is the economy growing?


GDP - YEAR OVER YEAR CHANGES

The economy is growing nicely at the 6% level - year over year. No cause for alarm here. If money growth is 5% and economic growth is in the 6% range, there is no cause for alarm.

Is there reason for prudence? Or, should lenders and investors take this as another buying opportunity?

The alternatives are either long bonds or Fed Funds at 5.25%.

This chart looks at 30 year bonds for the recent past.


30 YEAR US TREASURY SECURITIES

Bond yields are still in the 5% range, but Fed Funds are higher.

Until the Fed decides to cut short-term rates, or until loan demand starts to slow, the prudent thing for an investor is to put extra cash to work in Money Market Arbitrage.

Monday, October 16, 2006

Buying Opportunity in Bonds

Rarely does a market give a clear buy signal, but the US Treasury market is doing so today.

As the chart below shows, prices have broken out decisively through record volume, and returned to the breakout level to find support.


The weekly charts are clearer still. Here is a market that's made a double bottom, pushed up to resistance, found record volume, and pushed to new highs for the move.


It's time to add long-term fixed rate assets to the portfolio.

Gold prices are tamed, as the chart below shows. Inflation is no longer a worry.


TACTICS
Continue money market arbitrage. This will continue to be a money maker for at least another six months.

Begin adding long-term fixed rate assets with shorter-term liabilities.

Stop lengthening liability maturities.

STRATEGY
Inform senior management that the bear market in bonds is over.

The next Fed move will be to lower interest rates.

Be prepared for a long bull market in bonds: several years at least.

Reduce hedging programs, but continue to take advantage of yield spikes like the current one. They will come again, and are an excellent opportunity to add high-yielding assets.

Monday, October 02, 2006

Bear Market is Over!

The bear market in bonds began in March of 2006 and ended in September of the same year.

This must be one of the shortest bear markets in history.

As the daily chart below shows, bond prices blasted through resistance and are consolidating at higher levels.


WEEKLY PRICE ACTION
The chart below is weekly price action and shows clearly that we've surged through the price levels we saw in March.


The bear market is over.

TACTICS
- Continue money market arbitrage.
- Cover long term liabilities with longer term assets
- Prepare options and futures programs for price volatility
- Warn the board and senior management

STRATEGY
In a climate of uncertainty, it's best to be prudent, and this is a time like that. Do not overplay the end of the bear market.

Reduce the warning level to neutral, and let the subject sit for a few months. The Fed is in no hurry to lower rates, and will probably do nothing till 2007, when signs of slower economic growth might arise.

The money numbers tell us the future of the economy is sound.

Gold prices tell us inflationary expectations are crushed.

Bank's are lending on commercial real estate, which contains no prepayment option, thus locking in long-term yields.

There will be powerful profit opportunities in futures and options. Educate senior management and the Board, and prepare them for some hedging. Contact outside consultants on this issue.

Wednesday, September 20, 2006

Time to Widen the Fed Funds Band!

SUGGESTION:

Decrease Fed open market operations.

Allow overnight rates to fluctuate more than they do now.

Stop intervening in the markets except for permanent additions to the stock of money.

Increase the band sround the Fed Funds rate which causes the Fed to supply or drain funds.

REASONING
Look carefully at the changes in the basic money supply and you see volatility. Nothing but volatility.


Look carefully at the Fed Funds rate and you see stability. Nothing but stability.


To an economist, this is clear evidence of meddling by the Federal Reserve Bank's Open Market committee.

It's a misguided policy of interest rate stability; also called price controls. This is the last vestige of an obsolete activity.

Now that the economy has stabilized, it's time to let the market allocate overnight loans, rather than the OMC.

Let the Fed Funds rate fluctuate, as exchange rates do; as long-term interest rates do; as oil and gold prices do.

There will be no adverse effects if they widen the band around which the OMC performs open market operations and et short term interest rates fluctuate.

It's time for the Board of Governors to instruct the OMC to widen the bands on the Fed Funds target rate to at least one percentage point around the target rate each year until controls are ended.

Wednesday, September 06, 2006

CBOT Record!

CBOT August Volume Reaches Second Highest Monthly Total in Exchange History

The CBOT announced today that average daily volume (ADV) reached 3,341,170 contracts in August, an increase of 23 percent compared with August 2005.

Total volume for the month reaches second highest monthly total in CBOT history.

Monday, September 04, 2006

Volume Spike in Bonds


Both volume and open interest in the CBOT futures contract have spiked at this crucial juncture.

As the market moves away from this point, winners' hands get stronger, while losers' hands get weaker, reinforcing the movement in prices.

TACTICS

Sell bonds here.

Be ready to buy 'em back if they break out.

Be ready to go long if prices break out on the upside.

STRATEGY

Look out!

Warn the boss and the board.

This will mean a major inversion of the yield curve.

Next Fed move is down!

Saturday, August 26, 2006

Bond Market at Major Resistance

BONDS RALLY AFTER US TREASURY REFUNDING
In the weeks since the US Treasury sold 3, 10, and 30 year debt securities the bond market has rallied each week.


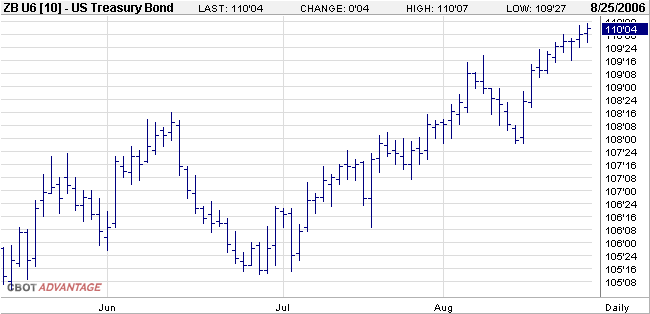
Here's the weekly data. Looks like a double bottom.


Bear markets don't behave like this. Something is going on.

Let's go to the charts.

GOLD - Daily prices till August 25th

Gold prices have broken. Unless money starts growing again, there is no upside for gold.


As we said back in July, when gold stops going up, so will Fed Funds.

Prudence will require the Fed to keep short rates at these levels for 6 months.

If the Fed knows it's business, it will widen the band for targeting Fed Funds and allow the market to allocate short term rates.

In addition, widening the band will also reduce the volatility of the Money supply.

MONEY SUPPLY - BASE, MZM, M1, M2
We present the data since the end of the last recession.

Monetary Base is growing nicely.


MZM has consistently declined and is still doing so, but still positive.


M1 Moves Into Negative Territory


After flirting with negative growth earlier in the year, M1 has moved into the red this past month.

As long as money doesn't grow, neither will inflation, or gold.

M2 Growing Nicely

M2 is growing at the 4% level


SUMMARY
Gold prices have broken decisively, bonds are making a base, money is under control.

TACTICS
Continue money market arbitrage and carefully add long-term assets as long as a profitable spread can be maintained.

STRATEGY
Hint - but only hint - that the bear market in bonds might be over.

Fed action to control bank lending has succeeded and money is not growing.

Short-term rates will stay high for another 6 months.

The bands on Fed Funds might widen and there will be more volatility in short term rates.

Strengthen the Treasury department and add a board member who's familiar with A/L management.

Monday, August 14, 2006

Day of Reckoning is Here

As we suggested last week, traders are selling into the recent rally.


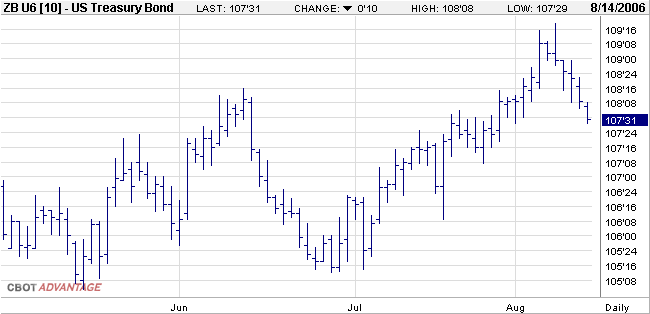
Prices are down a point and a half in the long-bond futures contract from the highs of last week.


In the days and weeks to come, the forces of inflation will battle those of higher short-term interest rates and in the end, Asset/Liability Mangers will have a clearer sense of direction for interest rates.


CURRENT MARKET SITUATION


As the chart above shows, bond prices have run up to the lows of last March, where this bear market began, and have fallen back.


TACTICS


Money Market arbitrage is the best policy for the next year or so.


Contact Paterson for more information.


STRATEGY


Continue to shrink the A/L portfolio, reducing long-term assets and liabilities, and adding to Fed Funds.

Monday, August 07, 2006

SHORTEST BEAR MARKET IN HISTORY?

As the Treasury auctions 3, 10, and 30 year securities, the bond market has rallied sharply, returning to the levels of March 2006 when this bear market began.


Experienced traders will be selling into this rally, expecting prices to fall as new supply enters the market.

Gold prices have broken.

Money is under control.

TACTICS
Sell into this rally, but be prepared in the weeks to come to change your opinion of this market.

STRATEGY
Continue to put new money into shor-term instruments and expand the Money Market Arbitrage operation.

Sunday, July 30, 2006

Treasury Refinancing in August

On August 2, 2006 the US Treasury will announce the size of the auction for 3, 10, and 30 year securities.

This event will give the markets a good idea about the demand for long-term debt.

In the current situation, it's most likely prices will fall prior to the auctions, and rise afterward, as Wall Street sells these securities to the public. This is the standard scenario in a bear market.

The size of the fall in prices will tell us what kind of orders the Primary Dealers have for this issue. Small decline means many orders.

However, if after the auction prices fall, it will signal the next stage in the bear market, begun in March of 2006, and an unwillingness by pension funds, insurance companies, and mutual funds to take on these securities in this bearish environment.

WARNING!
Recent analysis of money data for the past four years reveals a puzzle.

Money is not growing at the rate one would expect in a bear market. Neither the monetary base, MZM, M1, nor M2 are growing fast enough to generate inflation.

Something else is going on here, and it pays to be prudent.

TACTICS
Do not extend liability maturities past two years.

STRATEGY
Keep the book matched, and keep adding to overnight funds for the near future.

Fed Funds will continue to stay high for the next year - at least - to control inflationary expectations.

Keep an eye on gold prices. They will tell A/L managers if the Fed will continue to raise rates.

Monday, July 17, 2006

GOLD IS STILL THE STORY

As long as gold keeps going up, so will Fed Funds.


Long-term rates
Bond prices are not falling.

The bond market is a puzzle. Either gold is right, and inflation is coming, or the bonds are right, and inflation's under control.

Money Supply
Money usually tells the tale, but in this case, the data is confusing.

While most current money numbers are under control, past money growth has built a powerful backlog of fuel for price increases.

Money velocity increases as short rates rise, due to the increased benefit of leaving cash in an interest-bearing account, and this can temporarily increase demand.

Work the short end of the curve
Money market arbitrage is the tactic of choice at this time.

Call or email Paterson Financial for advice on making profits at the short end of the yield curve.

Monday, July 10, 2006

Fed's in a Box


GOLD PRICES LEAD THE WAY AGAIN
In the past week gold prices have risen from $575 to $625 and look like they will head higher in the coming months.

If so, the Fed is now in a box and cannot escape raising rates again, and perhaps for several more times.

From the outset of Fed action, back in 2004 the gold market has led the way in forecasting future Fed action. As gold rises, so must the target rate for Fed Funds.

Once the gold market broke, back in May of 2006, it appeared the Fed had done its job and could stop raising rates. As the perception of this intent soaked into market thinking, the bond market stabilized, the stock market corrected, and a sigh of relief escaped from bullish traders.

That thinking is now in jeapordy, and the gold market is telling A/L managers to be very careful.

If the gold market is right, and inflation is still a powerful force, then the Fed is not done tightening, and short term rates are certainly headed higher.

TACTICS
At times like this the A/L department, and its senior managers play an important role in the profitability of the institution.

1. Be aware of all market action. Start with money numbers, then keep an eye on gold, bonds, stocks and other commodities. Watch inflation and output numbers. Don't leave your desk even to get a glass of water.

2. Communicate to senior management. Give the CEO the information necessary to implement the A/L management plan.

3. Review new business to see that sufficient spreads are being built into every deal. Highlight any new business that is not profitable right away.

4. As old loans roll off, make sure the assets are invested in Fed Funds or a equally short-term instruments. Both safety and yield are enhanced by shortening asset maturities. Remember, Fed Funds is the highest spot on the yield curve. Take advantage of that fact and take credit for making profits. Consider using a Funds broker like Tullet Prebon. Ask for Mark Edelsberg.

5. Review hedging programs and obtain conditional authority from senior management for quick action.

6. Encourage Board participation where needed. Sometimes, the board wants to know what the A/L department is doing, and if they do, make sure to tell them. The A/L department makes decisions that affect the entire institution, and the Board must know about them, and approve. People lose their jobs over these kinds of mistakes.

STRATEGY
Be foresighted. Look out several quarters and see what kinds of business is rolling off, what kinds of business is being done, and where the institution is heading.

Consider alternative revenue streams. As spread lending comes under fire from rising Fed Funds, consider fee based activities. Recommend this course of action to senior management.

Most important, ring the warning bell. Even if this is the bottom in bond prices, the top in gold, and the beginning of a massive bull market in stocks; even if your institution is heading for spectacular profits; and even if your A/L book is in great shape, there is still great uncertainty out there. Be careful. Be prudent. Be clear to senior management. The trouble is not over, yet.

Monday, June 26, 2006

Disaster in the Making?

BREAKING NEWS
US Treasury Notes and Bonds broke recent support last week and are hovering below new resistance levels, waiting for bad news to propel them toward new lows.

It would be very surprising if bonds can rally from here.

If bonds start to go lower, it will be a major sell-off, confirming the trend begun back in Janury of 2006 and confirmed in early March when notes broke major support.

Paterson's analysis suggests the 10 Year US Treasury note could lose 5 full points in the coming months, increasing yields 70 basis points or more to US note yields in excess of 6%.

Changes of this magnitude will provide an opportunity to add high yielding assets only if the liabilty structure is in place to support it.

The job of the Asset/Liability department is to forsee this kind of action at this stage in the interest rate cycle and prepare the institution for the event.

ANALYSIS
Asset/Liability managers must warn senior management of potentially rising long term rates, and prepare them for an extensive program of lengthening liability maturities, shortening asset maturities, and pricing new assets conservatively, There also must be plenty of juice in every deal. Do not underprice deals!

Also, those institutions with the ability to trade futures, options, and swaps should prepare emergency hedging operations.

As we said last week, the money numbers look good, as do gold prices, so it seems this is a real demand for long term liabilities pushing up long rates, not just an inflation play.

Institutions will see increased demand for long-term loans as borrowers switch out of adjustable loans.

PATERSON's HEDGING AND TRADING SEMINARS
- Hands-on personal training for A/L managers and their teams
- Training for senior management
- Board of Directors presentations

PATERSON'S 2Q 2006 CHARTBOOK
Paterson's latest Chartbook will take a detailed look at the fundamentals of this quarter and analyze the situation in the debt markets.

Look for the Chartbook in the second week of July.

See www.paterson.com for details.

Jim Klein
Monday morning, waiting for the show to begin.